
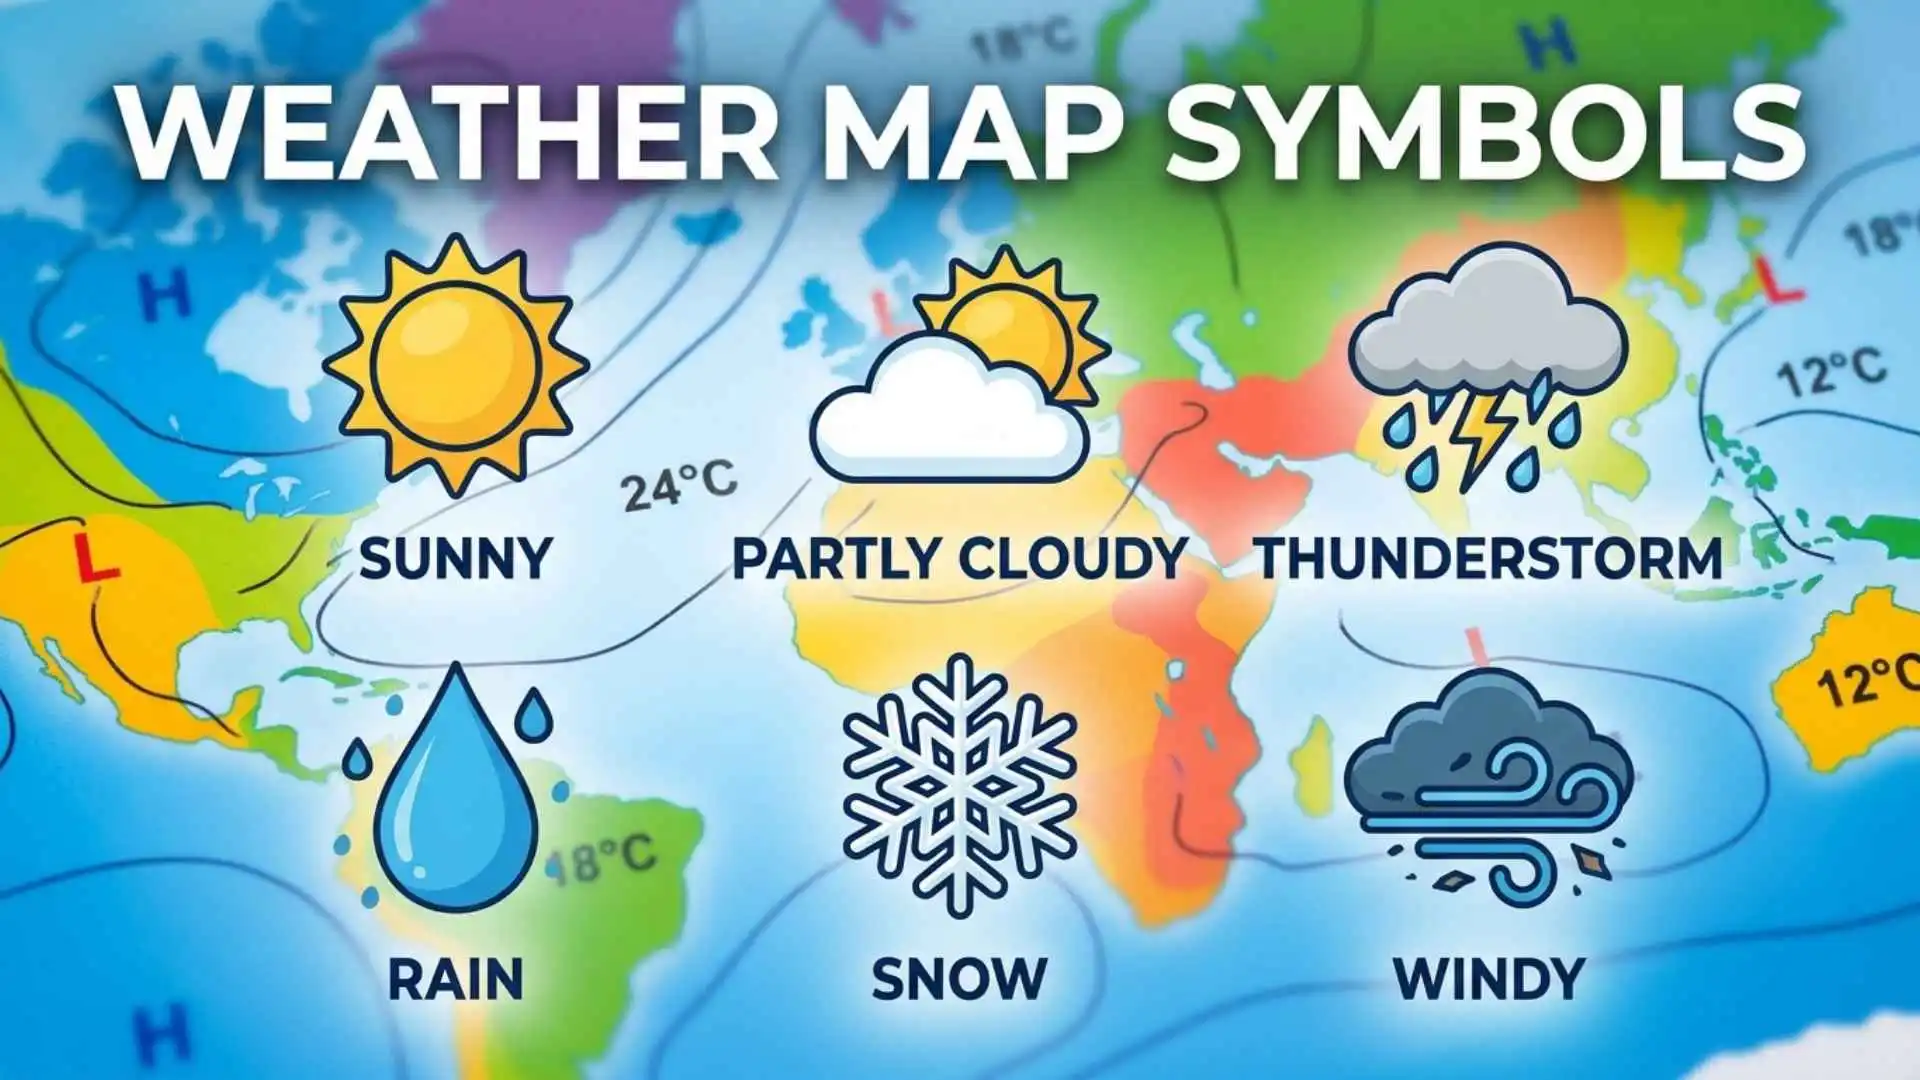
Weather map symbols help you understand weather conditions, track approaching storms, and make sense of daily forecasts. From clouds, rain, and snow to wind direction, temperature, and atmospheric pressure, these symbols turn complex weather information into easy-to-read visual displays. Whether you check weather maps before traveling, planning outdoor activities, or preparing for severe weather, knowing what each symbol represents can help you make better decisions.
Different types of weather maps use specific symbols to communicate atmospheric conditions and forecast changes. For example, cold fronts and warm fronts show where different air masses meet, while isobars represent areas of equal atmospheric pressure. Wind barbs indicate wind speed and direction, precipitation symbols identify rain or snow, and radar colors help show the intensity of storms. Learning these symbols makes it easier to recognize weather patterns and understand what meteorologists expect to happen.
In this complete guide to weather map symbols, you will discover the meanings of common weather signs, lines, colors, and patterns used on forecast maps. You will also learn how to read temperature maps, identify pressure systems, understand wind symbols, recognize weather fronts, and interpret radar and satellite images. Whether you are a beginner or simply want to understand weather forecasts more clearly, this guide will help you read weather maps with greater confidence.
Quick Answer
Weather map symbols are standardized signs used to show atmospheric conditions on weather charts. They represent features such as temperature, wind speed, wind direction, precipitation, cloud cover, air pressure, fronts, storms, and visibility. Meteorologists use them to communicate complex weather information quickly and consistently.
Quick Facts About Weather Map Symbols
| Aspect | Information |
| Origin | Developed from early weather observations, naval records, telegraph reports, and scientific meteorology |
| Historical Significance | Allowed weather conditions from different locations to be compared and mapped |
| Main Meaning | Visual representation of current or predicted atmospheric conditions |
| Spiritual Meaning | Often interpreted symbolically as change, uncertainty, cleansing, energy, or renewal |
| Cultural Importance | Helps communities prepare for storms, floods, heat, snow, and dangerous winds |
| Modern Usage | Used in television forecasts, weather apps, aviation charts, marine maps, and scientific reports |
What Are Weather Map Symbols?
Weather map symbols are visual marks that communicate information about the atmosphere. Instead of writing long descriptions for every location, meteorologists use simple shapes, lines, numbers, colors, and arrows.
A single weather station symbol can show several conditions at once, including:
- Air temperature
- Dew point
- Wind direction
- Wind speed
- Cloud cover
- Atmospheric pressure
- Current weather
- Recent pressure changes
Modern weather maps may also show fronts, pressure systems, radar precipitation, storm tracks, humidity, visibility, and severe weather warnings.
The Historical Origin of Weather Symbols
People have observed clouds, winds, and seasonal changes for thousands of years. Ancient farmers watched the sky to decide when to plant crops. Sailors studied wind direction, wave patterns, and cloud formations before beginning long journeys.
Scientific weather mapping became possible during the nineteenth century. The invention of the telegraph allowed observers in different cities to send weather reports almost instantly. Meteorologists could then place these reports on a map and identify large weather systems.
In 1854, a powerful storm destroyed many ships during the Crimean War. French astronomer Urbain Le Verrier studied reports from across Europe and showed that the storm had traveled through the region. His research helped demonstrate the value of organized weather observation and forecasting.
Over time, national weather agencies developed standardized symbols so observers, pilots, sailors, and scientists could understand the same maps.
Common Weather Map Symbols and Their Meanings
Different maps use slightly different designs, but most follow familiar meteorological standards.
High-Pressure Symbol
A high-pressure system is usually marked with a large H.
High pressure means the air is sinking toward the ground. Sinking air often limits cloud development, so high-pressure areas commonly bring dry, calm, and clear conditions.
In the Northern Hemisphere, winds generally circulate clockwise around high pressure. In the Southern Hemisphere, they usually circulate counterclockwise.
Low-Pressure Symbol
A low-pressure system is marked with a large L.
Low pressure forms where air rises. As rising air cools, water vapor may condense into clouds and precipitation. Low-pressure systems are therefore often associated with clouds, wind, rain, snow, or thunderstorms.
Winds circulate counterclockwise around low pressure in the Northern Hemisphere and clockwise in the Southern Hemisphere.
Cold Front Symbol
A cold front appears as a blue line with triangles. The triangles point in the direction the front is moving.
It marks the leading edge of a colder air mass pushing beneath warmer air. Because cold air is denser, it can force warm air upward quickly.
Cold fronts may produce:
- Heavy rain
- Thunderstorms
- Strong wind gusts
- Sudden temperature drops
- Clearing skies after passage
Warm Front Symbol
A warm front is shown as a red line with semicircles. The semicircles point toward the direction of movement.
It develops when warm air gradually rises over colder air. Warm fronts often bring widespread clouds and steady precipitation before warmer conditions arrive.
Stationary Front Symbol
A stationary front uses alternating blue triangles and red semicircles on opposite sides of a line.
It forms when a cold air mass and a warm air mass meet, but neither moves forward strongly. Stationary fronts can remain over one area for several days, causing prolonged clouds, rain, or snow.
Occluded Front Symbol
An occluded front is usually represented by a purple line with alternating triangles and semicircles on the same side.
It forms when a faster cold front catches up with a warm front. Occluded fronts are often connected with mature low-pressure systems and may produce wind, rain, snow, or mixed precipitation.
Trough Symbol
A trough is commonly shown as a dashed line.
It represents an elongated area of relatively low pressure. Troughs can encourage rising air, cloud development, showers, and thunderstorms, even when a complete front is not present.
Ridge Symbol
A ridge is an extended area of relatively high pressure. It may be shown with a curved line or identified by the shape of pressure contours.
Ridges often support stable, dry, and warmer conditions.
Understanding Weather Station Model Symbols
A station model is a compact collection of weather symbols placed around a central circle. Meteorologists use it to display observations from a particular weather station.
Central Circle and Cloud Cover
The amount of shading inside the central circle shows how much of the sky is covered by clouds.
| Circle Appearance | Approximate Cloud Cover |
| Empty circle | Clear sky |
| One-quarter shaded | Few clouds |
| Half shaded | Partly cloudy |
| Three-quarters shaded | Mostly cloudy |
| Fully shaded | Overcast |
| Circle with an X | Sky obscured or difficult to observe |
Temperature and Dew Point
The temperature usually appears in the upper-left area of a station model. The dew point is normally placed below it.
The dew point shows how much moisture is in the air. When temperature and dew point are close together, the air is nearly saturated. Fog, low clouds, or precipitation may be more likely.
Wind Barb Symbols
A wind barb extends from the station circle. It tells you both wind direction and speed.
The long shaft points toward the direction from which the wind is blowing. For example, a shaft extending north means the wind is coming from the north.
Small lines or flags on the shaft indicate speed:
- Short barb: 5 knots
- Long barb: 10 knots
- Triangle flag: 50 knots
A wind barb with two long lines and one short line represents 25 knots.
Atmospheric Pressure
Sea-level pressure normally appears in the upper-right part of a station model. It may be written using only the final three digits.
Meteorologists decode the number by adding a leading 9 or 10 and placing a decimal before the final digit. For example, 132 may represent 1013.2 millibars.
This compact system saves space on crowded weather charts.
Precipitation and Current Weather Symbols
Weather maps use small icons to represent conditions occurring at the observation site.
Common symbols include:
| Symbol or Icon | Meaning |
| Dot | Rain |
| Comma-like mark | Drizzle |
| Asterisk | Snow |
| Triangle | Hail |
| Zigzag or lightning icon | Thunderstorm |
| Horizontal lines | Fog |
| Infinity-like shape | Haze |
| Blowing lines | Blowing snow or dust |
| Mixed dot and asterisk | Rain and snow |
The number and arrangement of marks may show intensity. For example, several dots usually indicate heavier rain than a single dot.
Radar and Color-Coded Weather Map Symbols
Radar maps use color to show where precipitation is occurring and how intense it may be.
A common radar color scale includes:
- Light green for light rain
- Dark green for moderate rain
- Yellow for heavier rain
- Orange for very heavy rain
- Red for intense rain or strong thunderstorms
- Purple or white for extreme precipitation or possible hail
However, colors are not universal. A color used for heavy rain on one map may represent snow or freezing rain on another. Always check the map legend.
Winter weather maps may use blue for snow, pink for freezing rain, and purple for mixed precipitation.
Deep Symbolic Meaning of Weather Map Symbols
Weather map symbols are scientific tools, but weather itself has carried symbolic meaning across human cultures.
Spiritual Level
Storms, rain, wind, sunlight, and changing seasons often represent transformation. Rain may symbolize cleansing or renewal, while storms may represent struggle, power, or sudden change.
A weather map showing an approaching front can be viewed as a modern image of transition. One condition is leaving while another arrives.
These meanings are cultural interpretations, not part of meteorological science. Still, they show how strongly humans connect weather with inner experience.
Psychological Level
Weather symbols help reduce uncertainty. The atmosphere is invisible, yet it can create powerful and dangerous events. Maps make these hidden forces visible.
From a psychological perspective, this gives people a greater sense of awareness and control. A storm warning cannot stop the storm, but it can help a family prepare, change travel plans, or find shelter.
Carl Jung wrote about archetypal images that appear repeatedly across cultures. Storms, darkness, floods, and sunlight can function as broad symbolic patterns because nearly every human society has experienced them.
Cultural Level
Weather knowledge has always supported community survival. Farming societies depended on seasonal rain. Coastal communities watched wind and tides. Desert cultures learned to recognize signs of rare storms.
Modern weather symbols continue this shared tradition. They turn local observations into a visual language that can protect entire regions.
Weather Map Symbols Across Different Cultures
Ancient Egypt
The Nile flood shaped Egyptian agriculture and society. Egyptians connected natural cycles with divine order, especially through deities associated with the Nile, the sky, and fertility.
They did not use modern weather charts, but their calendars and records tracked seasonal environmental patterns.
Ancient Greece
Greek thinkers attempted to explain weather through both mythology and observation. Zeus was linked with thunder and lightning, while Aeolus was associated with the winds.
Aristotle’s Meteorologica examined rain, wind, clouds, earthquakes, and other natural phenomena. Although many explanations were incorrect by modern standards, the work helped establish weather as a subject of organized study.
Roman Culture
Roman sailors, soldiers, and farmers paid close attention to seasonal weather. The Romans inherited many Greek weather beliefs and connected storms, winds, and thunder with divine activity.
Practical weather knowledge was especially important for military movement, agriculture, and sea travel.
Eastern Traditions
Chinese scholars maintained detailed records of unusual weather, floods, droughts, and astronomical events. Weather was often connected with balance, social order, and the relationship between heaven and earthly leadership.
Traditional calendars also linked seasonal changes with farming, health, and community life.
Indigenous Traditions
Indigenous communities developed deep place-based knowledge of clouds, animals, wind, plants, water, and seasonal cycles.
These systems were not simple superstition. They were often built from generations of careful observation. Specific knowledge varies widely between nations and regions, so Indigenous weather traditions should never be treated as one universal belief system.
Modern Global Culture
Today, weather symbols form an international scientific language. A pilot, ship captain, emergency manager, or meteorologist can interpret many of the same signs across national borders.
Similar Weather Symbols and Their Differences
| Symbol | What It Represents | Common Confusion |
| Cold front | Advancing cold air | Mistaken for a general storm path |
| Warm front | Advancing warm air | Assumed to mean immediate warm sunshine |
| Stationary front | Boundary with little movement | Confused with an occluded front |
| Occluded front | Cold front overtaking warm front | Mistaken for a stationary front |
| Isobar | Equal atmospheric pressure | Confused with temperature lines |
| Isotherm | Equal temperature | Confused with pressure contours |
| Radar colors | Precipitation intensity or type | Assumed to be identical on every map |
Isobars are especially important. They connect places with equal air pressure. Closely spaced isobars indicate a strong pressure gradient and often stronger winds. Widely spaced isobars usually suggest lighter winds.
Weather Symbols in Mythology and Folklore
Before scientific forecasting, people explained severe weather through stories.
Thunder was linked with powerful gods such as Zeus in Greece, Jupiter in Rome, Thor in Norse tradition, and Indra in Vedic tradition. Wind could be treated as a spirit, messenger, or living force. Rain was often connected with fertility, blessing, or divine favor.
Some folklore used red skies, animal behavior, cloud shapes, and wind changes to predict weather. A few sayings reflected real observational patterns, while others were unreliable.
These traditions shaped the emotional meanings we still attach to storms, rainbows, lightning, and changing skies.
Weather Map Symbols in Art, Literature, Movies, and Pop Culture
Weather maps frequently appear in television news, disaster films, documentaries, and digital media. A swirling hurricane symbol can create immediate tension because viewers understand that danger is approaching.
Writers also use fronts, storms, and pressure as metaphors. A gathering storm may represent conflict. Clearing skies may suggest hope. Fog can symbolize uncertainty or confusion.
In modern design, weather icons appear on:
- Mobile applications
- Smartwatches
- Websites
- Travel dashboards
- Clothing
- Posters
- Educational charts
- Social media posts
Some people also use sun, lightning, cloud, or rain tattoos as symbols of resilience, energy, sadness, change, or renewal.
Spiritual and Dream Meaning of Weather Map Symbols
Dreaming about a weather map may reflect planning, uncertainty, or a desire to understand changing circumstances.
An approaching storm on a map may symbolize anticipated conflict or emotional pressure. A clearing system may suggest relief. Confusing symbols may reflect difficulty understanding what lies ahead.
Dream meanings are personal and are not scientifically fixed. The best interpretation depends on the dreamer’s emotions, experiences, and current situation.
Positive and Negative Meanings of Weather Map Symbols
| Positive Meaning | Negative Meaning |
| Preparation | Fear of uncertainty |
| Awareness | Anxiety about danger |
| Change | Disruption |
| Renewal | Loss or damage |
| Knowledge | Information overload |
| Connection with nature | Feeling powerless |
| Safety planning | Expecting the worst |
The same weather symbol can carry both light and shadow. A rain symbol may mean relief to a farmer but disappointment to someone planning an outdoor wedding.
Why Humans Are Attracted to Weather Map Symbols
Humans naturally search for patterns. Our ancestors needed to notice changes in wind, temperature, clouds, and animal behavior to survive.
Weather maps satisfy this same instinct in a modern form. They transform invisible atmospheric forces into clear visual patterns.
They also tell a story. A cold front moves across a region. Pressure falls. Clouds gather. Rain begins. The system passes, and calmer weather returns.
This movement feels familiar because human life also includes tension, change, and recovery.
Modern Uses of Weather Map Symbols
Weather symbols now appear in nearly every part of daily life, including:
- Television and online forecasts
- Smartphone weather apps
- Aviation weather charts
- Marine navigation systems
- Agricultural planning tools
- Emergency warning systems
- Road and travel reports
- Climate research
- School education
- Military operations
Meteorologists also use satellite images, computer models, radar data, and numerical forecasting. Symbols help present this complex information in a form the public can understand quickly.
Interesting Facts About Weather Map Symbols
- A wind barb shows where the wind comes from, not where it is going.
- Closely packed isobars often suggest stronger winds.
- Front symbols point in the direction the front is moving.
- Weather radar does not directly show rain reaching the ground in every case. Some precipitation may evaporate before arrival.
- Purple commonly represents an occluded front.
- A fully shaded station circle usually means an overcast sky.
- Weather map colors may have different meanings across apps and forecasting services.
- Early modern weather maps became practical after telegraph communication allowed observations to arrive quickly.
- Hurricanes are areas of very low pressure, but not every low-pressure system becomes a hurricane.
- Meteorologists combine symbols with real-time observations, satellites, radar, and computer models rather than relying on one map alone.
Frequently Asked Questions
What do the H and L symbols mean on a weather map?
H represents a high-pressure system, which often brings calmer and clearer weather. L represents a low-pressure system, which is more likely to bring clouds, wind, rain, or snow.
What do triangles and semicircles mean on weather maps?
Blue triangles mark a cold front, while red semicircles mark a warm front. Their direction shows where the front is moving.
What do the lines on a weather map represent?
Lines may represent fronts, isobars, isotherms, troughs, or ridges. Their meaning depends on the line style, color, and map legend.
How can I tell wind speed from a weather symbol?
Wind barbs use short lines for 5 knots, long lines for 10 knots, and triangular flags for 50 knots. Add the marks together to calculate total wind speed.
Why do weather radar maps use different colors?
Radar colors show precipitation type or intensity. Green often means light rain, while yellow, orange, and red usually indicate heavier precipitation. The exact scale varies, so check the legend.
Are weather map symbols the same worldwide?
Many professional meteorological symbols are internationally standardized, but colors, icons, and simplified app symbols may differ between countries and forecasting services.
Conclusion
Weather map symbols turn invisible atmospheric changes into a language we can see and understand.
They help us identify pressure systems, fronts, wind, clouds, precipitation, and possible danger.
Beyond science, they reflect humanity’s ancient need to read nature, recognize patterns, and prepare for change.
Once you learn these symbols, every weather map becomes a story about what the sky is doing and what may happen next.
 Sarah Thompson
 John Mercer